
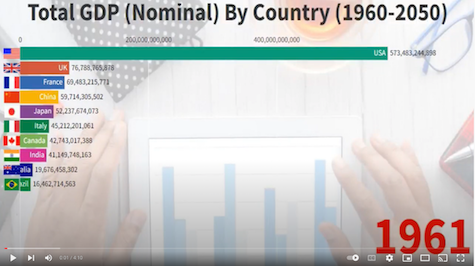
World GDP Ranking (1960~2025)
The following animated chart covers the period from 1960 to 2025. It is fascinating to see how the world changes over time.
Information on this website is based on current regulatory requirements and laws, which may be subject to change. While care has been taken in the preparation of this information, no liability is accepted by Count, its related entities, agents and employees for any loss arising from reliance on information within.